Last August, I completed Kaggle’s “30 Days of Machine Learning” challenge and found the online courses and hands-on coding exercises quite useful.
Spanning three modules: Python, Intro to Machine Learning and Intermediate Machine Learning, it was designed to equip a novice with no prior programming or data science knowledge with basic machine learning skills.
It also served as an enticing introduction to the 14 other modules offered (for free!) by Kaggle Learn, covering numerous topics in data science and machine learning.
In the spirit of continuous learning, I decided to take the plunge and finish all the remaining modules, one at a time. It took me another 30 days, over a span of several months, to finally read through all the tutorials and complete all the exercises.
I’m happy to report that it was time well-spent, and provided me with a working understanding of the many foundational skills and helped me appreciate the many possible applications.
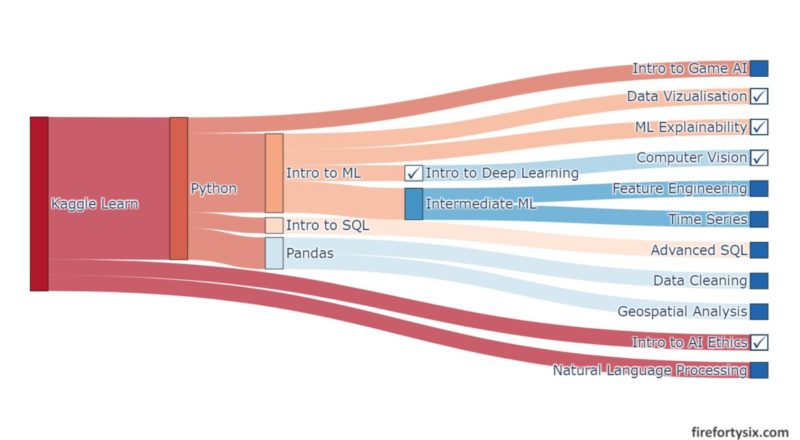
Here’s a Sankey diagram that I created using the Plotly package that shows all the dependencies and prerequisites for each module. Scroll all the way down, past the Python code, to see the final rendered Sankey.
Committing to finishing all the modules in Kaggle Learn may seem a bit daunting, but perhaps reading my short overview and highlights of each course might motivate you to bite the bullet too.
Come on in, the water is warm, and not too deep.
I’ve already covered the first 3 modules in an earlier post, and plan to cover the remaining 14 modules across three separate posts. Starting with this Part 1 on Intro to Deep Learning, Computer Vision, Data Visualization, Intro to AI Ethics and Machine Learning Explainability.
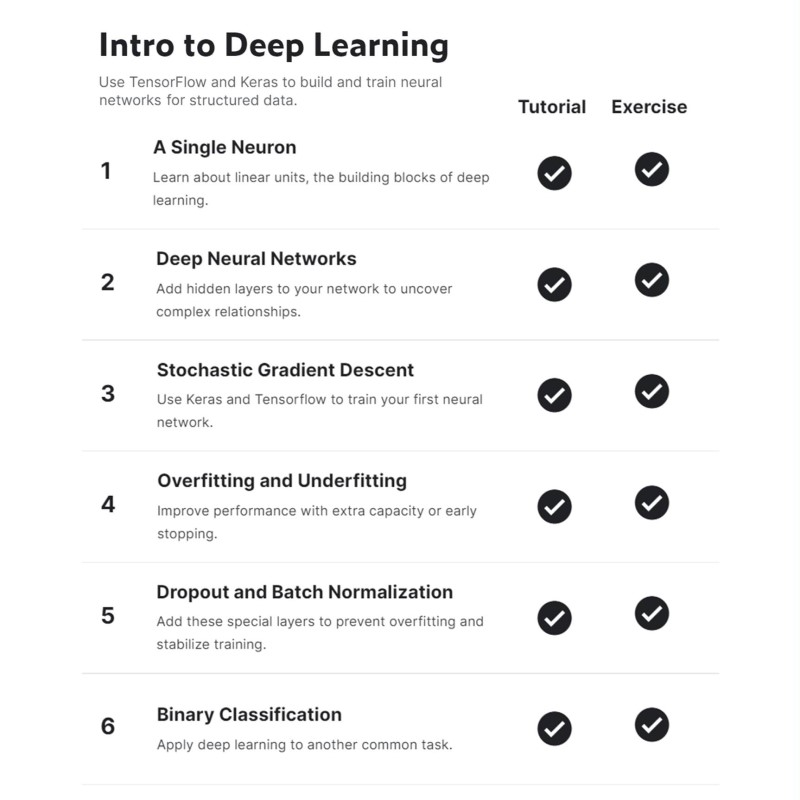
Intro to Deep Learning
This was the very first module I started after completing the 30 Day challenge, mainly because it was the topic that I was most interested in.
The tutorials and exercises were well paced, starting with the concept of a single neuron and then expanding into deeper neural networks.
Along the way, algorithms like Stochastic Gradient Descent are introduced, together with considerations like over/under-fitting, dropout and batch normalisation.
Going through the material was so enjoyable that I wrote an entire post focusing on just this one module, so that I would remember and have a summary to use as a refresher for future reference.
I also tried applying what I learnt by coding up a simple neural network and using it to submit results during the final few days of the 30 Days of Machine Learning competition.
See the code cells below if you’re interested to get an idea of how straightforward it is to setup and train a deep neural network using Keras and TensorFlow.
Computer Vision
I’ve always heard that computer vision systems use Convolutional Neural Nets (Convnets or CNNs) to differentiate between different images, but didn’t know the mechanics behind it until I completed this module.
It starts by introducing the two-step process of image classification, starting with a convnet “base” to extract features and then using a non-convnet “head” to classify the image.
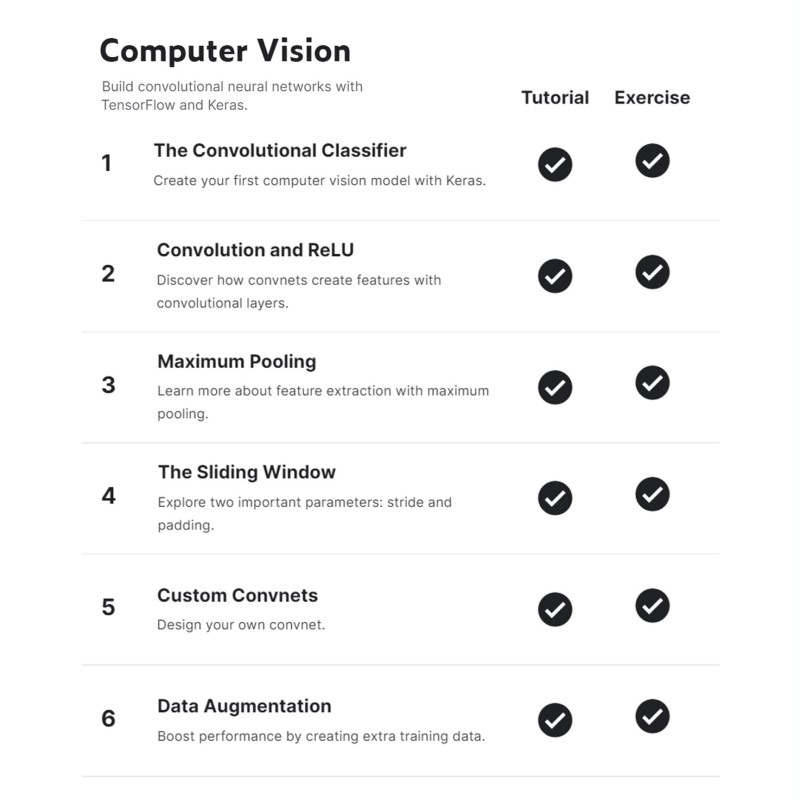
The feature extraction step is then broken down into three basic operations: (i) filtering an image for specific features, (ii) detecting the feature within the filtered image and (iii) condensing the image to enhance the features.
Filtering is done with convnets using kernels as weights, detecting uses rectified linear units (ReLU) and condensing is achieved by a technique called maximum pooling.
Practical implementations typically attach a pre-trained “base” (e.g. VGG16) to a custom-built “head”, but the exercises walk you through how to setup an end-to-end solution using Keras. Such as the example below with three filter/detect/condense “base” layers attached to the final sequential “head”.
The tutorials are particularly illuminating, given the many visual examples provided such as the one below illustrating the outcomes after the filter, detect and condense operations. They definitely help bring the concepts to life.

Data Visualization
The quote below from the second paragraph of the first tutorial is an accurate reflection of what you’ll learn after completing the module.
“… if you’ve never written a line of code, and you want to learn the bare minimum to start making faster, more attractive plots today, you’re in the right place!”
When I was deciding between R or Python as my first language to learn for data science, the ease of creating good-looking and interactive data visualizations in Jupyter notebooks using various visualization modules pointed me to Python.
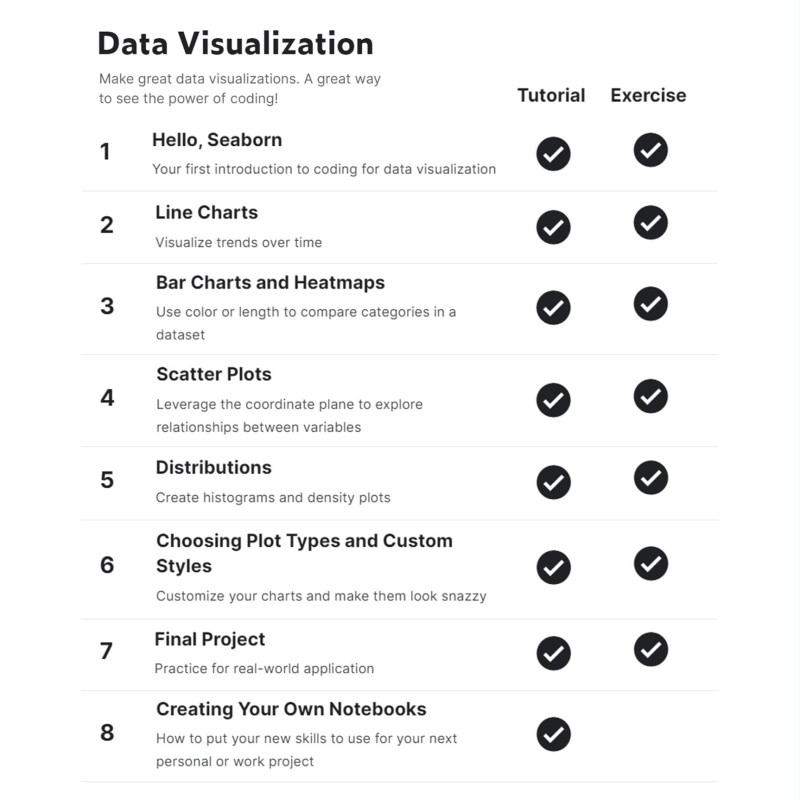
Using the basic Matplotlib and Seaborn packages, the module handholds you through the creation of foundational visualizations like line charts, bar charts, heatmaps, scatterplots and distributions that you’ll be using most of the time during actual exploratory data analysis.
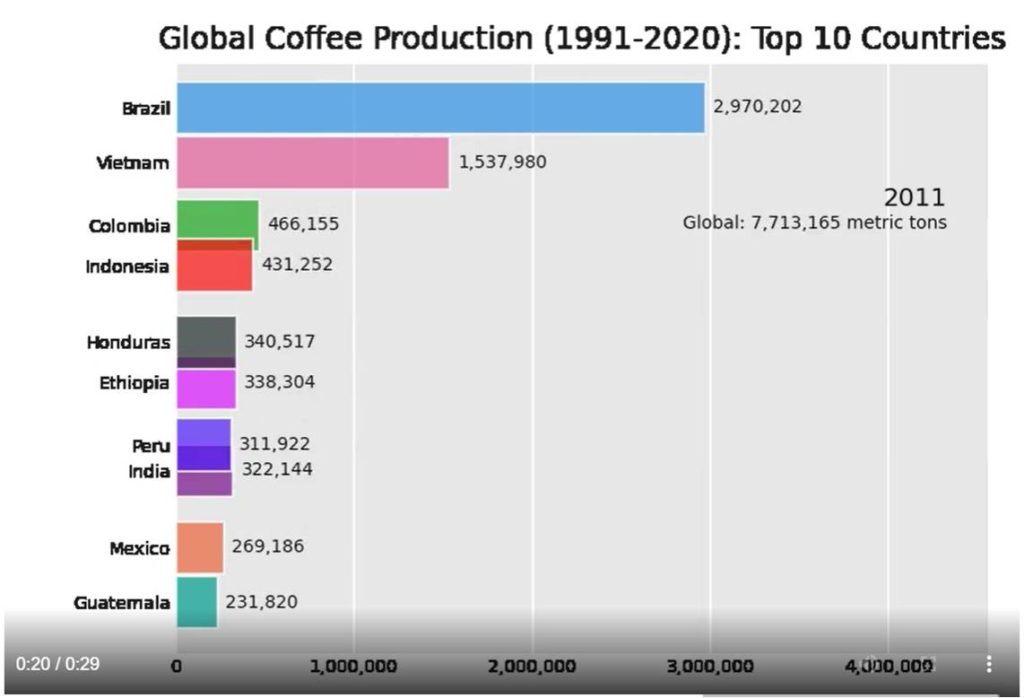
Once you’ve gotten the hang of creating basic data visualizations, you’ll quickly realise how easy and fun it is to create more advanced ones using the numerous open source Python packages out there. Including a choropleth plot and animated bar chart race on global coffee production that I created using data from the International Coffee Organisation from 1991 to 2020.
Intro to AI Ethics
There’s an increasing focus, and rightly so, on the ethics surrounding the use of AI and machine learning. Especially as more and more AI models are deployed in the real world and affecting real lives.
If you’re primarily interested in learning about algorithms and building machine models, it’s tempting to skip over this module since it’s less technically-focused and more human-centric.
But it’s good to step back, at least for a few hours, and consider the impact of AI on society and think about topics such as bias, fairness and transparency.
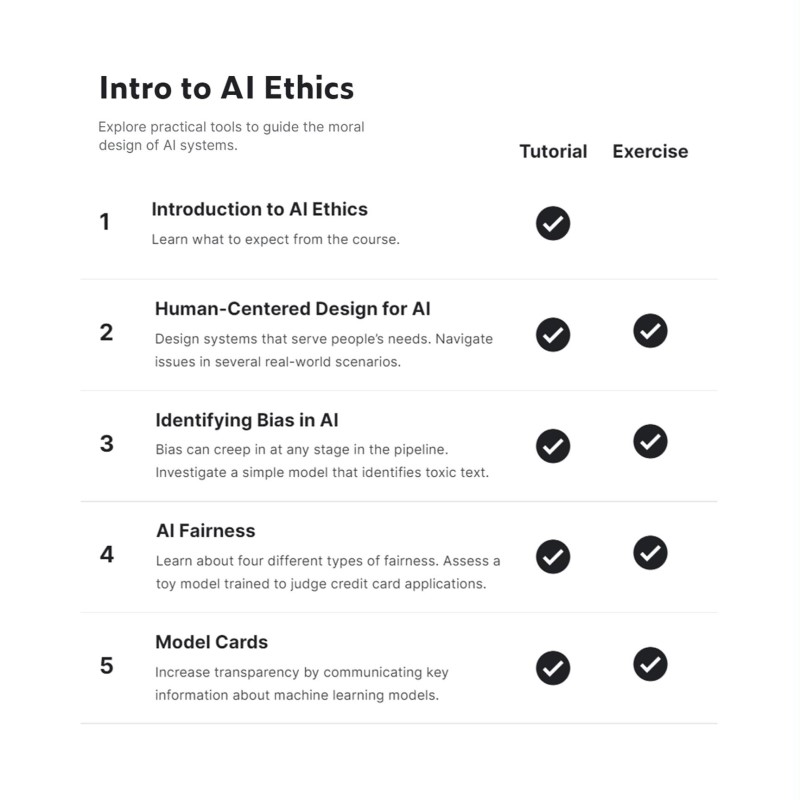
Take, for example, the six step Human-Centred Design (HCD) explained in the second tutorial:
- Understand people’s needs to define the problem
- Ask if AI adds value to any potential solution
- Consider the potential harms that the AI system could cause
- Prototype, starting with non-AI solutions
- Provide ways for people to challenge the system
- Build in safety measures
And the six types of bias that could exist, unintentionally or otherwise, in AI models as described in the third tutorial:
- Historical bias
- Representational bias
- Measurement bias
- Aggregation bias
- Evaluation bias
- Deployment bias
They probably won’t be that important until you start building models and deploying them to production, but having them at the back of your mind right from the start will definitely help inform your choices along the way.
Machine Learning Explainability
One common criticism of machine learning models are that they are “black boxes” that don’t reveal or explain how outputs are generated.
It’s also one of my main concerns when learning about different models. A core guiding principle that I hope to abide by is to be able to explain how results are achieved, and never have to use the phrase “that’s what the model says.”
Given the complexity and opacity of many machine learning models, it will definitely be a challenge. But overcoming the challenge will make the models, and the results they produce, more understandable and hence, easier to accept.
I found this module particularly useful, and even though it only scratches the surface of this very complex topic, it introduces several powerful techniques and concepts.

These techniques are particularly useful since they can be applied to any model, however simple or complex. They don’t make the black box completely transparent and allow you to see all the detailed inner workings, but they do give you an idea of how outputs change when inputs are modified.
Permutation Importance starts with a fitted model, and then randomly shuffles a single column of input data (i.e. one input feature) to see how badly (or not) the predicted outputs are affected. The main idea being that if the shuffled feature messes up the output a lot, then it was an important input to the model.
Here’s an example from one of the exercises in the module, using the Eli5 package. The features are ranked in decreasing order of weights, with the higher ranking features having higher importance.
Another powerful technique is the use of SHAP Values (SHaply Additive exPlanations), via the Shap package, to break down a prediction to show the impact of each feature. Again, this works regardless of the model used and is very flexible.
The module doesn’t go into the mathematics behind it, but points to an article that provides more detail and insight.
Part 2
I hope my short summaries above have given you an idea of what to expect in each module, and have been interesting enough to entice you to take the courses yourself.
Part 2 of this series will cover the more data-centric modules, including Pandas, Intro to SQL, Advanced SQL, Data Cleaning and Feature Engineering.
Stay tuned!