During the dark days of the pandemic last year, we started running down our wine inventory in the vegetable compartment of our fridge.
Why? Because one, we needed the space for vegetables due to increased home-cooking, and two, pandemic drinking was a legitimate way of coping with the depressing news. Or at least that’s what we told ourselves.
The initial progress was encouraging, and we managed to clear up significant space in the fridge. But I should have realised the slippery slope that we were going down once we started drinking regularly.
That, as well as the convenience and lure of online marketplaces like Shopee, Lazada and Amazon, where all sorts of alcohol are just a few clicks away, especially yuzu sake and nihonshu.
One thing led to another, and our fridge is full again. Not only that, but the storeroom is starting to get crowded as well.
To determine how bad the situation had gotten, I decided to do a one-off stock take of all the alcohol in our apartment and compile a complete inventory.
| Item | Type | Vol (ml) | ABV (%) |
|---|---|---|---|
| Kuheiji JDG Eau Du Désir | Sake | 1,440 | 16% |
| Born JDG Gold | Sake | 720 | 15% |
| Dewazakura JDG Yukimegami 48 | Sake | 720 | 16% |
| Kubota JG Senju | Sake | 720 | 15% |
| Born JG Migaki 55 | Sake | 720 | 16% |
| Castaño Dulce Monastrell 2017 | Wine | 500 | 16% |
| Knight Black Horse Thai Lychee 2014 | Wine | 750 | 12% |
| Ayala Rosé Majeur NV | Wine | 750 | 12% |
| Billecart-Salmon Brut Rosé NV | Wine | 750 | 12% |
| Aubert Chardonnay Lauren 2013 | Wine | 750 | 15.5% |
| Nikka Taketsuru Pure Malt 17y | Whiskey | 750 | 43% |
| Prince Scotch 18y | Whiskey | 500 | 40% |
| Kavalan Podium | Whiskey | 200 | 46% |
| Kavalan Wine Oak | Whiskey | 200 | 54% |
| Jack Daniels Tennessee | Whiskey | 100 | 43% |
| Martell Noblige Cognac | Liquor | 600 | 40% |
| Kanade Yuzu Liqueur | Liquor | 500 | 20% |
| Ki No Bi Kyoto Gin | Liquor | 300 | 46% |
| Jose Cuervo Especial | Liquor | 500 | 40% |
| Absolut Vodka Citron | Liquor | 400 | 40% |
| Disaronno Amaretto | Liquor | 700 | 28% |
| Cointreau Orange Liqueur | Liquor | 400 | 40% |
| Taiwan Beer Gold Label | Beer | 1,980 | 5% |
| Taiwan Beer Lychee | Beer | 1,980 | 3.5% |
| Taiwan Beer Honey | Beer | 1,980 | 4.5% |
| Woorisool Chestnut Makgeolli | Others | 3,000 | 6% |
| Woorisool Yuzu Makgeolli | Others | 750 | 6% |
| Choya Yuzu | Others | 700 | 15% |
| Umenoyado Yuzushu | Others | 720 | 8% |
| Total | 24,080 |
Yes, you read that correctly, we currently own 24 litres of alcohol.
I think I’m going to stop buying alcohol now.
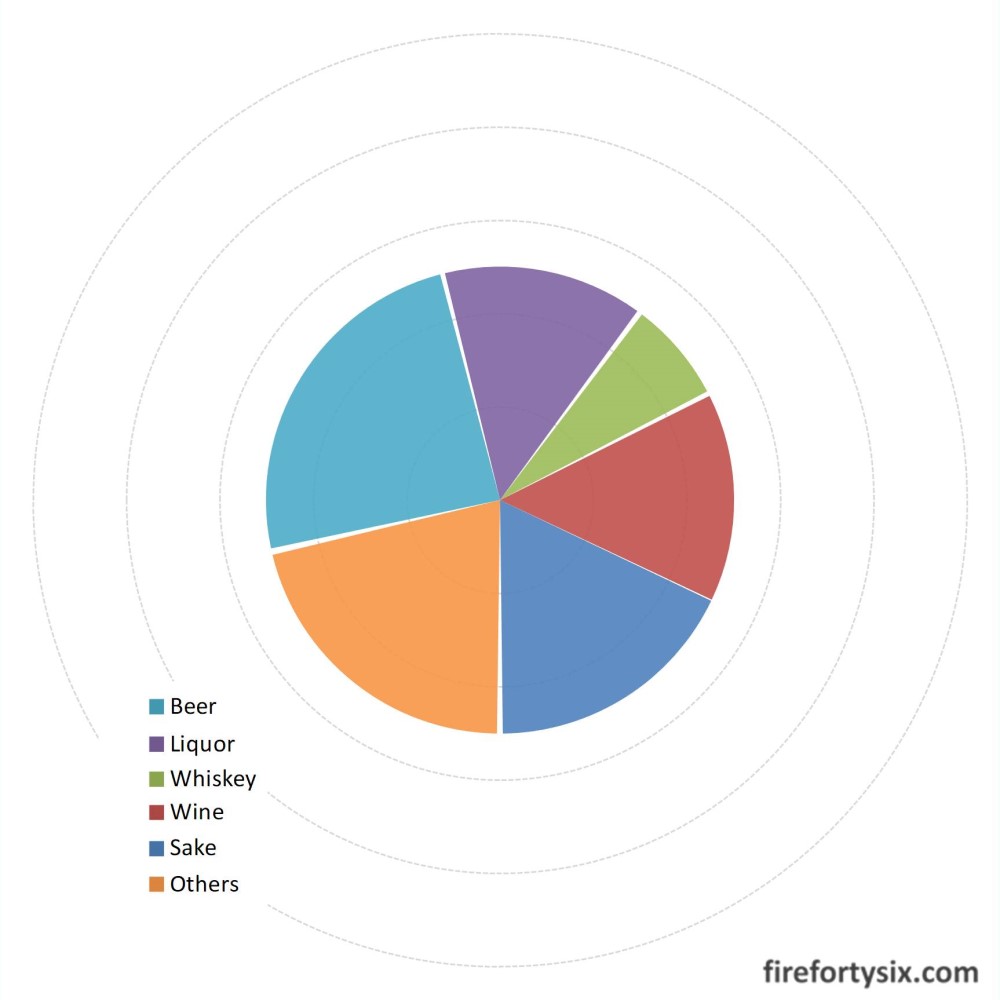
Since I had all this data compiled, I thought it’d be nice to put it in chart form, starting with a pie chart showing the breakdown of the different types of alcohol.

It would appear that most of our alcohol is in Beer form, with Whiskey comprising the smallest volume.
But clearly not all drinks are the same and the key metric to consider is ABV, or alcohol by volume. Beer has the lowest ABV and Whiskey has the highest, so even though total Whiskey volume is low, the relative amount of effective alcohol could be quite high.
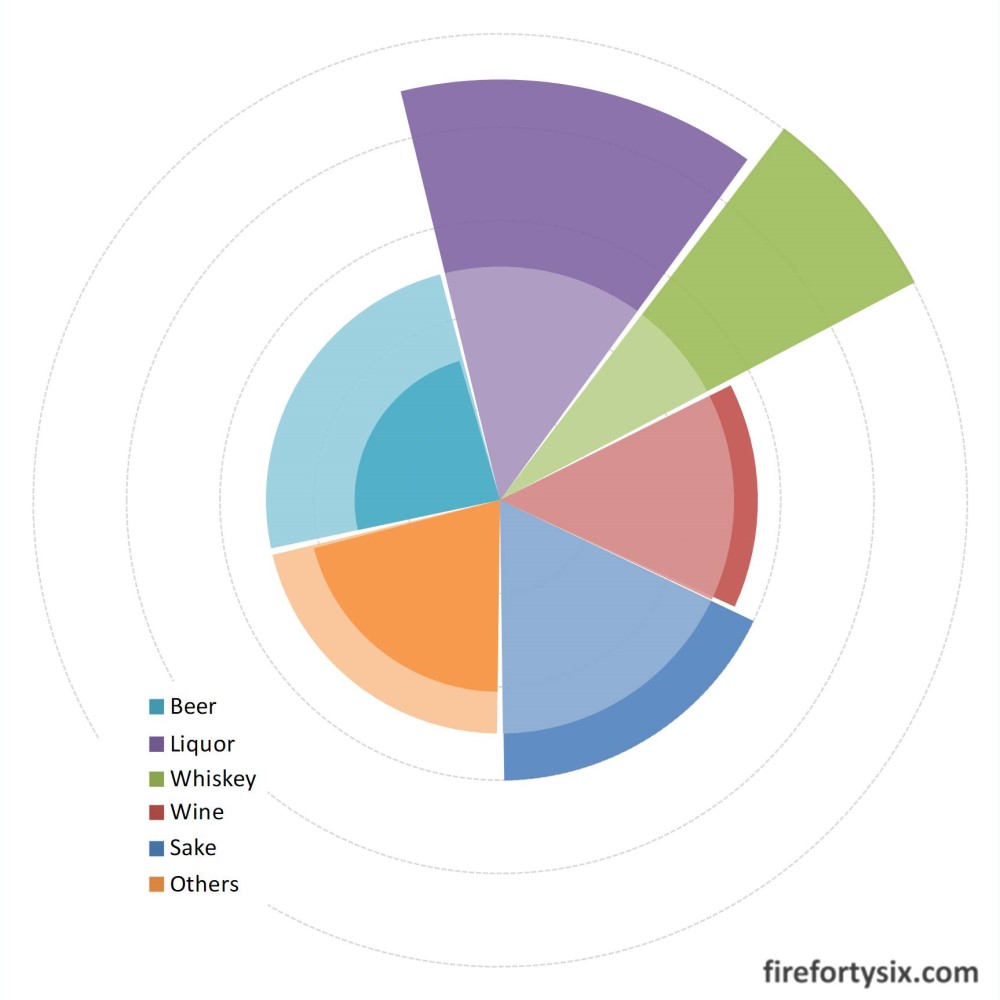
Instead of plotting another boring pie chart of Vol x ABV, I created a more interesting Spie Chart.
According to its creator, Dror G. Feitelson:
A spie chart is a combination of two pie charts: one sets the angles of the slices, and the other sets their areas, by manipulating the radius of each slice individually. This enables an easy comparison of the partitions represented by the two charts.More details can be found in his 2003 paper “Comparing Partitions with Spie Charts”.
Using the same slice angles from the previous pie chart, I overlaid another pie chart using different a radius for each slice, with effective Vol x ABV represented by their respective areas.

You can see that even though the angle of the green Whiskey slice is small, its high ABV results in a longer radius and the slice “sticks out”. The reverse is true for the cyan Beer slice, which “shrinks in”.
Spie charts can be quite useful but they’re not commonly used, and I have a feeling that most people don’t even know that they exist.
I couldn’t find a quick way to generate the charts using Excel or Python, so I had to manually create them in Powerpoint by drawing and re-sizing the individual slices. Not having an easy way to create a spie chart also means that people are less likely to use it.
Anyway, the main point is that we currently have too much alcohol on our hands. We’ll be implementing a moratorium on new purchases until we manage to bring down the inventory to a reasonable level.
Let’s say, 10 litres? Or until the vegetable compartment of the fridge becomes relatively empty again, whichever comes first.
In the meantime, I guess we’ll just have to carry on drinking. Responsibly, of course, and always in moderation.
