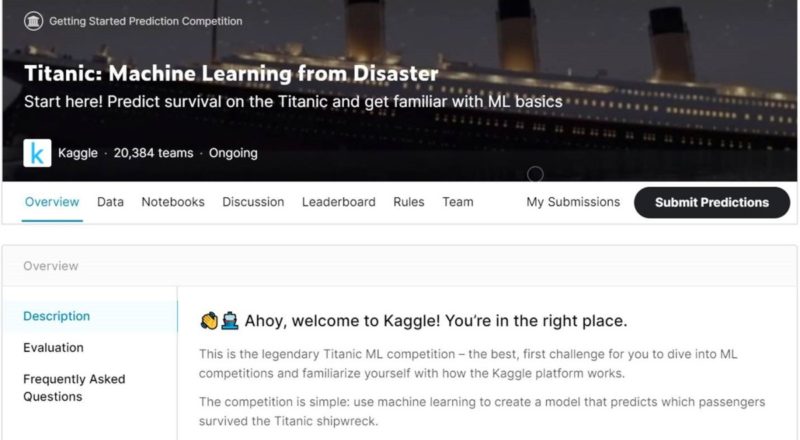
The first port of call for all Kagglers is the “Titanic: Machine Learning from Disaster” practice competition, where you get to use machine learning to create a model that predicts which passengers survived the Titanic shipwreck.
You start by first watching Rachel Tatman, Kaggle Data Scientist, give an enthusiastic introductory YouTube video.
And then you go through the tutorial written by Alexis Cook, Head of Kaggle Learn.

The data provided for this competition is split into two parts: a training dataset that you use to build and train your machine learning model, and a testing dataset that run your completed model on to predict which passengers survive. There is also a sample results file provided to jumpstart your very first submission.

First Submission
The results used for the first submission is based on the assumption that all female passengers survived and all male passengers died a.k.a. the Kate Winslet survival model. All you have to do is to download the gender_submission.csv file and submit it as your first prediction.

Which turns out to be a rather good “model” for something so simple, allowing you to achieve a score of 0.76555 out of 1.00000.

This puts you on the tail-end of the leaderboard with a low ranking (#15,864 out of 20,471 participants).


Second Submission
Continue with the Titanic tutorial to build a Kaggle notebook that uses a random forest machine learning algorithm to improve your prediction.
Go to the Notebooks section in Kaggle.com to create a new notebook. Since the tutorial also provides Python code that can be used directly, simply cut-and-paste each code fragment into your notebook and run them sequentially, making sure that the outputs generated by your notebook match those in the tutorial.
I faced a small hiccup in the beginning with regards to adding competition data, because the tutorial didn’t explicitly define the steps required. But that was quickly sorted out by clicking “+ Add data” near the top right section of my notebook and choosing the correct dataset.

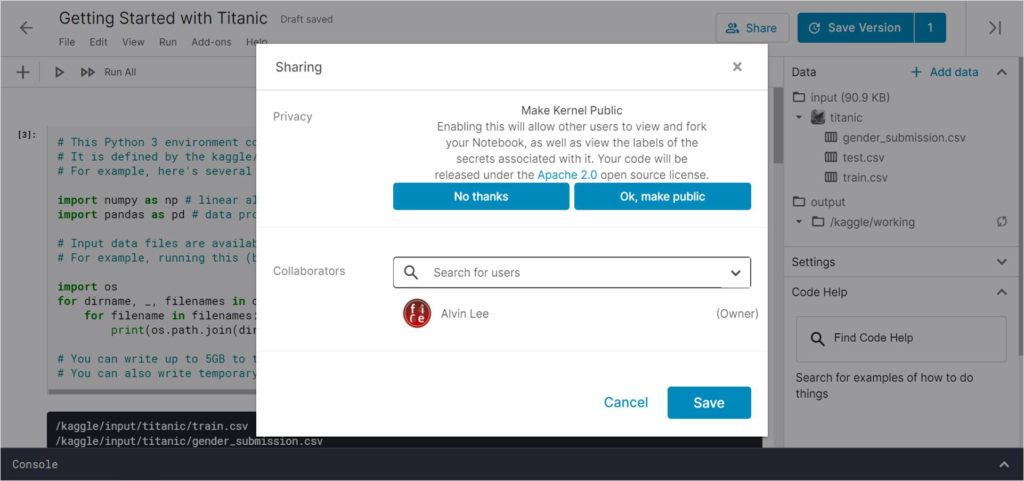
Here’s a screenshot of the notebook I created.

Note that all personal notebooks created as set to Private by default, but you can change this to make them Public by clicking on the “Share” icon on the top right nav bar.

Submission of prediction results is done directly from the notebook by saving it using the “Save & Run All (Commit)” setting …

… viewing the version that was saved and scrolling down to the Output section, where you will see a “Submit” button used to submit your results.

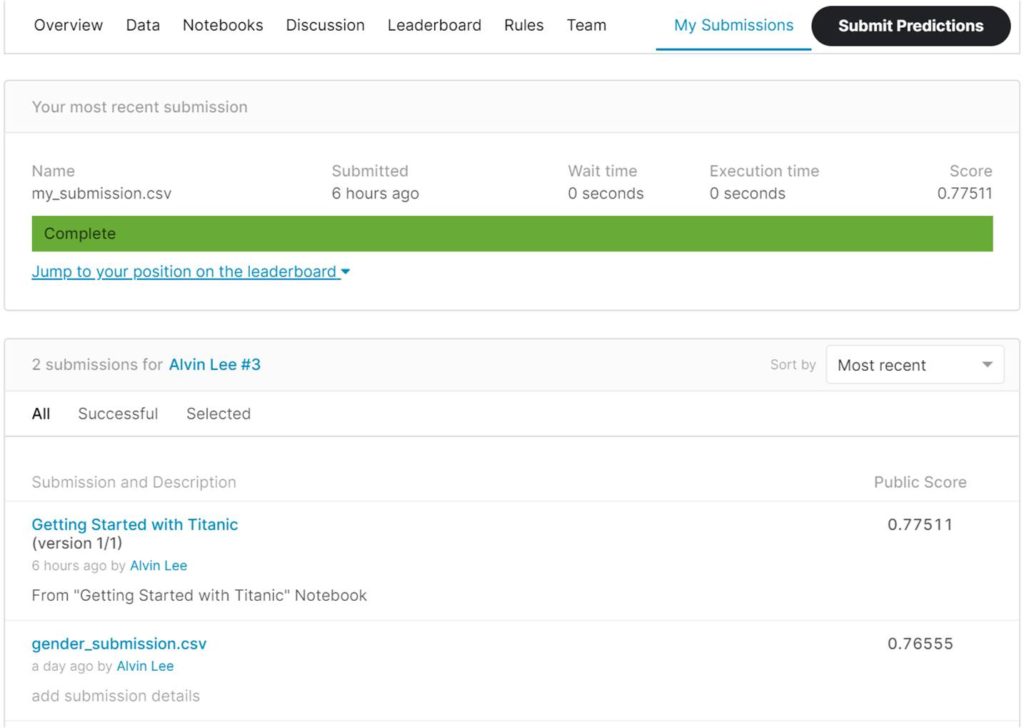
Surprisingly, moving from the simple “all women survive” model to a more advanced random forest model didn’t improve the results by much. It only improved the score by 1.2% from 0.76555 to 0.77511.


But then again, I didn’t actually do any actual data science analysis or modelling and basically just cut-and-pasted code provided in the tutorial.
Next Steps
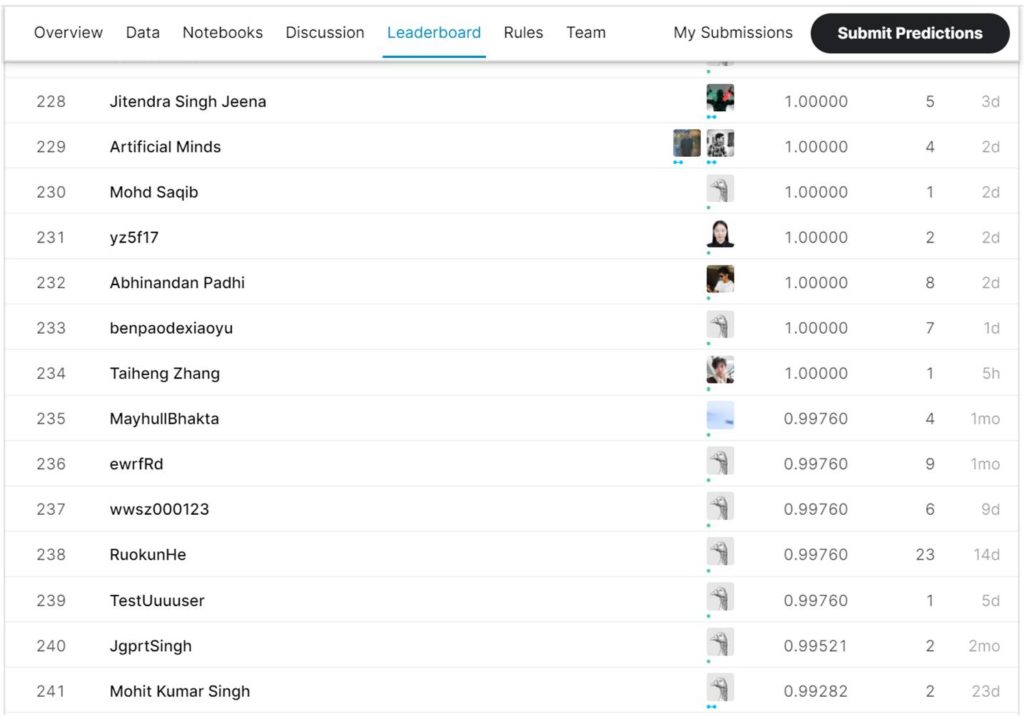
Scrolling down the leaderboard, I observed that the top 234 participants were able to achieve perfect scores of 1.00000, so that’s something to aim for in my subsequent submissions.

My next steps include:
- Running exploratory data analysis (EDA) to better understand the statistical properties of both the train and test datasets, including data visualisations where they would help provide insight
- Conducting feature engineering to choose the most appropriate features (i.e. input variables), including creating new features via data transformations like normalisation where necessary
- Trying other machine learning algorithms such as logistic regression, support vector machines (SVM), including using ensemble models by combining results from different algorithms
Achieving a perfect 1.00000 score would be great, but I’d be happy to be ranked within the 95th percentile; which in a total field of about 20,000 means achieving a rank of #1,000 or better.
Looking at the current scores on the leaderboard, that translates to a score of 0.80622, which would require a 4.0% improvement from my current score of 0.77511. The scores on the leaderboard are dynamic though, so it’s going to be a moving target.
This Titanic practice competition is more entertaining that I expected. Who knew data science could be so fun!
All image credits: Kaggle

[…] […]